PJSC Polyus (LSE, MOEX — PLZL) (“Polyus”, the “Company”, and together with the Company subsidiaries, the “Group”) has today released its consolidated financial results for three and nine months ended 30 September 2018.
Key highlights
- Total gold sales volumes of 699 thousand ounces, up 32% compared to the second quarter. This includes 92 thousand ounces of gold contained in concentrate from Olimpiada.
- Revenue of $832 million, up 20% compared to $692 million in the second quarter, driven by a seasonal increase in sales from the alluvial operations and higher flotation concentrate sales volumes from Olimpiada. The group’s revenue includes sales from Natalka starting from the third quarter of 2018, following the cessation of its capitalisation from 1st of August 2018.
- The group’s TCC remained flat at $345 per ounce. This figure includes TCC at Natalka, which amounted to $685 per ounce in the third quarter. A seasonal increase in output at the structurally higher cost alluvial operations put additional pressure on the group’s TCC. These factors were fully mitigated by local currency depreciation as well as by-product credit from sales of antimony-rich flotation concentrate, which amounted to $33 per ounce in the third quarter.
- Adjusted EBITDA was $537 million, an 18% increase from the second quarter 2018, driven by higher gold sales volumes. Adjusted EBITDA margin stood at 65%.
- Profit for the period increased to $144 million, reflecting the increase in operating profit and the impact of non-cash items. Foreign exchange loss was lower compared to the previous quarter.
- Adjusted net profit was $355 million, a 22% decrease from the previous quarter, which reflects the impact of non-cash item such as lower foreign exchange loss in the period.
- Net cash generated from operations was $423 million, compared to $376 million in the previous quarter.
- Capital expenditures (“capex”) was $146 million, a decrease on the previous quarter, reflecting lower capital expenditures across most of the business units. Separately, as of 1 August the Company ceased the capitalisation of borrowing costs and other directly attributable operating costs at Natalka.
- Cash and cash equivalents as at 30 September 2018 were $1,000 million, compared to $908 million as at 30 June 2018. The increase was driven by the strong operational performance in the reporting period.
- Net debt decreased to $3,029 million, compared to $3,208 million as at the end of the second quarter.
- The net debt/adjusted EBITDA ratio decreased to 1.6x compared to 1.8x as at 30 June 2018, reflecting a decrease in the net debt position and growth in adjusted EBITDA.
Pavel Grachev, Chief Executive Officer of PJSC Polyus, commented:
Polyus demonstrated solid operational and financial performance in the reporting period.
We have delivered double-digit growth in EBITDA in the quarter. The Company maintains its status of one of the lowest-cost producers globally, as our total cash costs remained at $345 per ounce for the second consecutive quarter.
Based on the Company’s performance for the first nine months, we are adjusting our cost guidance downwards, with total cash costs now expected to stay below $400 per ounce for the full year 2018.
We also remain on track to meet our production guidance. Polyus anticipates its full year production to be in the upper end of the initial guidance of 2.375-2.425 million ounces of gold.
Comparative financial results
|
$ million (if not mentioned otherwise) |
3Q 2018 |
2Q 2018 |
Q-o-Q |
3Q 2017 |
Y-o-Y |
9M 2018 |
9M 2017 |
Y-o-Y | |
|---|---|---|---|---|---|---|---|---|---|
| Operating highlights | |||||||||
| Gold production (koz) 1 | 691 | 602 | 15% | 642 | 8% | 1, 800 | 1, 580 | 14% | |
| Gold sold (koz) | 699 | 531 | 32% | 578 | 21% | 1, 689 | 1, 561 | 8% | |
| Realised prices | Average realised refined gold price (excluding effect of SPPP) ($/oz) 2 | 1, 209 | 1, 300 | (7%) | 1, 279 | (5%) | 1, 275 | 1, 254 | 2% |
| Average realised refined gold price (including effect of SPPP) ($/oz) | 1, 213 | 1, 300 | (7%) | 1, 279 | (5%) | 1 277 | 1, 269 | 1% | |
| Financial performance | |||||||||
| Total revenue | 832 | 692 | 20% | 744 | 12% | 2, 141 | 1, 978 | 8% | |
| Operating profit | 442 | 385 | 15% | 410 | 8% | 1, 159 | 1, 064 | 9% | |
| Operating profit margin | 53% | 56% | (3) ppts | 55% | (2) ppts | 54% | 54% | 0 ppts. | |
| Profit for the period | 144 | 114 | 26% | 371 | (61%) | 502 | 974 | (48%) | |
| Earnings per share — basic (US Dollar) | 1.02 | 0.83 | 23% | 2.74 | (63%) | 3.72 | 7.60 | (51%) | |
| Earnings per share – diluted (US Dollar) | 1.00 | 0.74 | 35% | 2.73 | (63%) | 3.53 | 7.60 | (54%) | |
| Adjusted net profit 3 | 355 | 457 | (22%) | 298 | 19% | 1,035 | 773 | 34% | |
| Adjusted net profit margin | 43% | 66% | (23) ppts | 40% | 3 ppts | 48% | 39% | 9 ppts | |
| Adjusted EBITDA4 | 537 | 457 | 18% | 475 | 13% | 1,381 | 1,237 | 12% | |
| Adjusted EBITDA margin | 65% | 66% | (1) ppts | 64% | 1 ppts | 65% | 63% | 2 ppts | |
| Net cash flow from operations | 423 | 376 | 13% | 398 | 6% | 1,060 | 948 | 12% | |
| Capital expenditure5 | 146 | 219 | (33%) | 205 | (29%) | 547 | 525 | 4% | |
| Cash costs | |||||||||
| Total cash cost (TCC) per ounce sold ($/oz)6 | 345 | 345 | 0% | 380 | (9%) | 355 | 380 | (7%) | |
| All-in sustaining cash cost (AISC) per ounce sold ($/oz)7 | 571 | 601 | (5%) | 599 | (5%) | 611 | 606 | 1% | |
| Financial position | |||||||||
| Cash and cash equivalents | 1,000 | 908 | 10% | 1,121 | (11%) | 1,000 | 1,121 | (11%) | |
| Net debt8 | 3, 029 | 3, 208 | (6%) | 3, 151 | (4%) | 3, 029 | 3, 151 | (4%) | |
| Net debt/adjusted EBITDA (x)9 | 1.6 | 1.8 | (11%) | 1.9 | (16%) | 1.6 | 1.9 | (16%) |
Total Cash Costs
The group’s TCC remained flat at $345 per ounce compared to the previous quarter. This figure includes TCC at Natalka, which amounted to $685 per ounce in the third quarter. A seasonal increase in output at the structurally higher cost alluvial operations put additional pressure on the group’s TCC. These factors were fully mitigated by local currency depreciation as well as by-product credit from sales of antimony-rich flotation concentrate, which amounted to $33 per ounce in the third quarter.
TCC performance by mine, $/oz
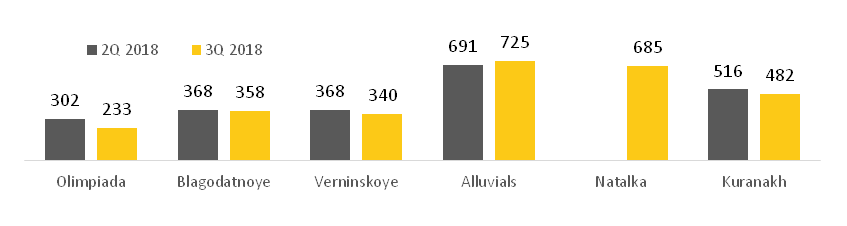
During the period TCC at Olimpiada amounted to $233 per ounce, down 23% compared to the second quarter. This decline was mainly attributable to an increased share of lower cost flotation concentrate in the total gold sold during the quarter as well as by-product credit from sales of antimony-rich flotation concentrate in the amount of $61 per ounce. The local currency depreciation also contributed to the improved cost performance. These factors were partially offset by higher maintenance expenses and diesel price inflation.
At Blagodatnoye, TCC amounted to $358 per ounce, down 3% compared to the second quarter of 2018, mainly due to the local currency depreciation. Inflation in diesel prices was offset by lower maintenance expenses and higher gold sales volumes.
TCC at Verninskoye was $340 per ounce, down 8% compared to the second quarter of 2018, mainly due to the local currency depreciation during the period. Higher gold sales volumes fully offset higher maintenance costs.
At Kuranakh, TCC amounted to $482 per ounce, down 7% compared to the second quarter of 2018 mainly due to the local currency depreciation.
TCC at Alluvials was $725 per ounce, up 5% compared to $691 per ounce in the second quarter of 2018, reflecting the write-off of seasonal deferred expenditures and increase in fuel prices. These factors were partially offset by the local currency depreciation and lower spare parts and explosives costs.
At Natalka, TCC amounted to $685 per ounce. Starting from 1st of August 2018 the group includes operating costs related to Natalka within the cost of gold sales.
All-in sustaining costs (AISC)
The group’s AISC amounted to $571 per ounce, down 5% compared to the second quarter.
All-in sustaining costs by mine, $/oz
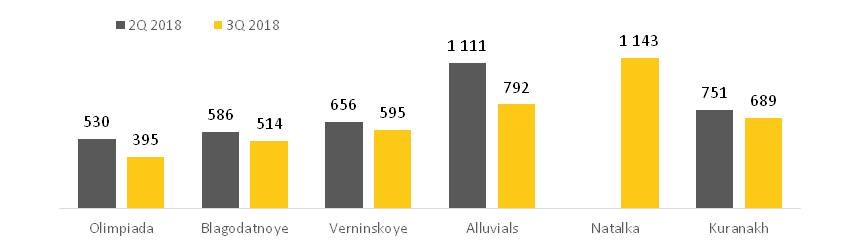
AISC at Olimpiada decreased to $395 per ounce, while at Blagodatnoye AISC decreased to $514 per ounce. Both were driven by lower TCC for the period. AISC at Verninskoye decreased to $595 per ounce, while AISC at Kuranakh decreased to $689 per ounce, both in line with TCC and reflecting lower sustaining capital expenditures during the period. AISC at Alluvials decreased to $792 per ounce in the third quarter driven by lower sustaining capital expenditures. AISC at Natalka amounted to $1,143 per ounce.
Capex
Capital expenditures decreased to $146 million, from $219 million in the second quarter.
Capital expenditures at Natalka decreased to $40 million. Purchase of equipment during the period amounted to $36 million, compared to $46 million in the second quarter. Mining fleet procurement is ongoing with a TYHI WK-20 excavator delivered on site in the reporting period. Construction works at the Natalka Mill’s auxiliary and infrastructure facilities are in progress. This includes earthworks at the fuel warehouse and finishing works for an assay laboratory. The Company conducted scheduled maintenance works in July-August 2018. Over the course of the maintenance works, the gyratory crusher MK-60-110E was put back into operation.
The Company ceased capitalisation of borrowing costs and other directly attributable operating costs from 1st of August 2018. Total capitalised costs net of gold revenue amounted to $4 million in the third quarter of 2018.
By the end of the third quarter, as the Natalka Mill reached its design throughput run rate, the ball mill motor went out of order due to a deformation of the mounting face for the bearing on the rotor shaft. Consequently, the Company has switched to a shortened flowsheet, utilizing a one-stage grinding (SAG mill only) process and therefore bypassing the ball mill, which resulted in lower throughput rates and recoveries. The Company anticipates the ball mill to resume operation post repairs in November 2018 and expects the mill to revert promptly to operating at full capacity. In December, Natalka will undergo scheduled maintenance.
Capital expenditures at Olimpiada and Blagodatnoye decreased to $46 million and $6 million, respectively, as the Company completed an active phase of mining fleet procurement in the first half of 2018. Polyus is continuing to expand its mining fleet, increasing the share of large-scale mining equipment. The Company is currently implementing further mill expansion projects at Olimpiada and Blagodatnoye, where it expects to reach throughput capacity of 13.4 million tonnes per annum and up to 9.0 million tonnes per annum respectively in the coming years.
At Verninskoye, capital expenditures increased to $11 million due to scheduled maintenance and a prepayment for a TYHI WK-20 excavator.
Capital expenditures at Kuranakh decreased to $10 million. Stage 3 of the capacity expansion project to reach 5.8 million tonnes per annum is expected to be completed in 2019.
At Alluvials, capital expenditures decreased to $4 million, as the Company completed the replacement of worn-out equipment in the second quarter.
The total cash amount spent on the purchase of PP&E decreased to $198 million, compared to $215 million in the previous quarter. This mainly reflects the respective decrease in total capital expenditures outlined above.
At Sukhoi Log, the logging and interpretation of the verification drilling results have been completed. The in-fill drilling program is in progress. The geotechnical and hydrogeological drilling program has been launched, and Polyus has launched the Pre-feasibility Study.
Other investing activities in the third quarter of 2018 included $6 million of interest received.
Capex breakdown10
| $ million |
3Q 2018 |
2Q 2018 |
Q-o-Q |
9М 2018 |
9М 2017 |
Y-o-Y |
|---|---|---|---|---|---|---|
| Natalka, including | ||||||
| Purchase of equipment | 36 | 46 | (22%) | 127 | 173 | (27%) |
| Capitalisation of borrowing costs | 7 | 24 | (71%) | 54 | 69 | (22%) |
| Operating costs | - | 8 | N.A. | 25 | 42 | (40%) |
| Net proceeds from selling gold produced during the ramp-up period | (3) | (14) | (79%) | (20) | - | N.A. |
| Natalka, total | 40 | 64 | (38%) | 186 | 284 | (35%) |
| Olimpiada | 46 | 64 | (28%) | 146 | 93 | 57% |
| Blagodatnoe | 6 | 34 | (82%) | 57 | 30 | 90% |
| Verninskoye | 11 | 9 | 22% | 30 | 23 | 30% |
| Alluvials | 4 | 8 | (50%) | 18 | 17 | 6% |
| Kuranakh | 10 | 14 | (29%) | 33 | 39 | (15%) |
| Other 11 | 29 | 26 | 12% | 77 | 39 | 97% |
| Capex | 146 | 219 | (33%) | 547 | 525 | 4% |
|
Omchak electricity transmitting line |
10 | 8 | 25% | 27 | 21 | 29% |
| Items capitalised12, net | 28 | 10 | N.A. | 43 | 20 | N.A. |
| Change in working capital for purchase property, plant and equipment | 14 | (22) | N.A. | (4) | (35) | (89%) |
| Purchase of PP&E13 | 198 | 215 | (8%) | 613 | 531 | 15% |
Conference call
A conference call for investors and analysts hosted by Pavel Grachev (Chief Executive Officer) and Mikhail Stiskin (Senior Vice President, Finance and Strategy) will be held on 7 November 2018 at 10.00 (London) / 13.00 (Moscow).
To join the conference call, please dial:
Conference ID: 1713680
UK
+44 (0)330 336 9411 (Local access)
0800 279 7204 (Toll free)
USA
+1 929-477-0402 (Local access)
888-224-1121 (Toll free)
Russia
+7 495 646 9190 (Local access)
8 10 8002 8675011 (Toll free)
To access the replay, please dial:
Passcode: 1713680
UK
+44 (0) 207 660 0134 (Local access)
0 808 101 1153 (Toll free)
USA
+1 719-457-0820 (Local access)
888-203-1112 (toll free)
Russia
810 800 2702 1012 (Toll free)
Polyus
Polyus is the largest gold producer in Russia and one of the top ten gold miners globally with the lowest cost position. Based on its 2017 Ore Reserves and Mineral Resources, Polyus group ranks second both by attributable gold reserves and gold resources among the world’s largest gold mining companies.The Polyus group’s principal operations are located in Krasnoyarsk, Irkutsk and Magadan regions and the Republic of Sakha (Yakutia).
Enquiries:
Investor contact
Victor Drozdov, Director Investor Relations
+7 (495) 641 33 77
drozdovvi@polyus.com
Media contact
Victoria Vasilyeva, Director Public Relations
+7 (495) 641 33 77
vasilevavs@polyus.com
Forward looking statements
This announcement may contain «forward-looking statements» concerning Polyus and/or Polyus group. Generally, the words “will”, “may”, “should”, “could”, “would”, “can”, “continue”, “opportunity”, “believes”, “expects”, “intends”, “anticipates”, “estimates” or similar expressions identify forward-looking statements. The forward-looking statements involve risks and uncertainties that could cause actual results to differ materially from those expressed in the forward-looking statements. Forward-looking statements include statements relating to future capital expenditures and business and management strategies and the expansion and growth of Polyus’ and/or Polyus group’s operations. Many of these risks and uncertainties relate to factors that are beyond Polyus’ and/or Polyus group’s ability to control or estimate precisely and therefore undue reliance should not be placed on such statements which speak only as at the date of this announcement. Polyus and/or any Polyus group company assumes no obligation in respect of, and does not intend to update, these forward-looking statements, except as required pursuant to applicable law.
1 Gold production is comprised of 624 thousand ounces of refined gold and 67 thousand ounces of gold in flotation concentrate in the third quarter of 2018 and 539 thousand ounces of refined gold and 63 thousand ounces of gold in flotation concentrate in the second quarter of 2018 respectively.
2 The Strategic Price Protection Programme (“SPPP”) comprises a series of zero-cost Asian gold collars (“revenue stabiliser”).
3 Adjusted net profit is defined by the Group as net profit / (loss) for the period adjusted for impairment loss / (reversal of impairment), unrealised (gain) / loss on derivative financial instruments and investments, net, foreign exchange (gain) / loss, net, and associated deferred income tax related to such items.
4 Adjusted EBITDA is defined by the Group as profit for the period before income tax, depreciation and amortisation, (gain) / loss on derivative financial instruments and investments (including the effect of the disposal of a subsidiary and subsequent accounting at equity method), finance costs, net, interest income, foreign exchange gain, net, impairment loss / (reversal of impairment), (gain) / loss on property, plant and equipment disposal, expenses associated with an equity-settled share-based payment plan and special charitable contributions as required to ensure calculation of the Adjusted EBITDA is comparable with the prior period. The Group has made these adjustments in calculating Adjusted EBITDA to provide a clearer view of the performance of its underlying business operations and to generate a metric that it believes will give greater comparability over time with peers in its industry. The Group believes that Adjusted EBITDA is a meaningful indicator of its profitability and performance. This measure should not be considered as an alternative to profit for the period and operating cash flows based on IFRS, and should not necessarily be construed as a comprehensive indicator of the Group’s measure of profitability or liquidity.The Group calculates Adjusted EBITDA margin as Adjusted EBITDA divided by total revenue.
5 Capital expenditure figures are presented on an accrual basis (here presented net of the Sukhoi Log deposit license acquisition cost and net of Omchak power grid construction cost). For details see reconciliation on page 21 of MD&A.
6 TCC is defined by the Group as the cost of gold sales, less property, plant and equipment depreciation and amortisation, provision for annual vacation payment, employee benefits obligation cost and change in allowance for obsolescence of inventory and adjusted by inventories. TCC per ounce sold is the cost of producing an ounce of gold, which includes mining, processing and refining costs. The Group calculates TCC per ounce sold as TCC divided by total ounces of gold sold for the period. The Group calculates TCC and TCC per ounce sold for certain mines on the same basis, using corresponding mine-level financial information.
7 AISC is defined by the Group as TCC plus selling, general and administrative expenses, stripping activity asset additions, sustaining capital expenditures, unwinding of discounts on decommissioning liabilities, provision for annual vacation payment, employee benefit obligations cost, and change in allowance for obsolescence of inventory less amortisation and depreciation included in selling, general and administrative expenses. AISC is an extension of TCC and incorporates costs related to sustaining production and additional costs which reflect the varying costs of producing gold over the life-cycle of a mine. The Group believes AISC is helpful in understanding the economics of gold mining. AISC per ounce sold is the cost of producing and selling an ounce of gold, including mining, processing, transportation and refining costs, general costs from both mine and alluvial operations, and the additional expenditures noted in the definition of AISC. The Group calculates AISC per ounce sold as AISC divided by total ounces of gold sold for the period.
8 Net debt is defined as non-current borrowings plus current borrowings less cash and cash equivalents and bank deposits.Net debt excludes derivative financial instrument assets/liabilities, site restoration and environmental obligations, deferred tax, deferred revenue, deferred consideration for the Sukhoi Log licence and other non-current liabilities. Net debt should not be considered as an alternative to current and non-current borrowings, and should not necessarily be construed as a comprehensive indicator of the Group’s overall liquidity.
9 The Group calculates net debt to Adjusted EBITDA as net debt divided by Adjusted EBITDA.
10 The capex above presents the capital construction-in-progress unit as allocated to other business units, whilst in the condensed consolidated interim financial statements capital construction-in-progress is presented as a separate business unit.
11 Reflects expenses related to exploration business unit, construction of Razdolinskaya-Taiga, Peleduy-Mamakan grid lines and Sukhoi Log expenses, net of the deposit license acquisition cost and payments to Rostec (“RT”).
12 Including capitalised stripping costs net of capitalised interest on loans and capitalised within capital construction-in-progress. For more details see Note 11 of the condensed consolidated interim financial statements.
13 Presented net of the Sukhoi Log deposit license acquisition cost and payments to RT.