PJSC Polyus (LSE, MOEX — PLZL) (“Polyus”, the “Company”, and together with the Company’s subsidiaries, the “Group”), the largest gold producer in Russia, has today released its consolidated audited financial results for the year 2017.
Financial highlights — 4th quarter of 2017
- Gold sales increased by 3% compared to the 3rd quarter to 597 thousand ounces. Total gold sales include 82 thousand ounces of gold contained in concentrate from Olimpiada.
- Revenue totalled $743 million in the 4th quarter and remained almost flat compared to $744 million in the 3rd quarter of 2017.
- Group TCC1 decreased by 15% to $324 per ounce from $380 per ounce in the 3rd quarter, while AISC2 increased to $662 per ounce, up 11% compared to the 3rd quarter of 2017.
- Adjusted EBITDA3 amounted to $465 million, a 2% decrease from the 3rd quarter of 2017.
- Adjusted EBITDA margin stood slightly lower at 63%, compared to 64% in the 3rd quarter of 2017.
- Profit for the period decreased to $267 million, partly reflecting the decrease in operating profit and impact of non-cash items in the period.
- Adjusted net profit4 amounted to $242 million, a 19% decrease from the previous quarter.
- Net cash inflow from operations amounted to $344 million in the 4th quarter of 2017.
- Capex5 increased to $279 million compared to the previous quarter, primarily reflecting increased spending on the brownfield development projects and the ongoing construction works at Natalka.
- Net debt6 decreased to $3,077 million at the end of the 4th quarter of 2017 compared to $3,151 million as at the end of the 3rd quarter of 2017.
Operational highlights — 4th quarter of 2017
- Total gold output decreased by 10% quarter-on-quarter to 580 thousand ounces, mainly due to a seasonal slowdown in production at Alluvials.
- Volumes of ore mined increased by 2% to 10,065 kt.
- Volumes of ore processed increased by 7% q-o-q to 7,809 kt driven by the start of hot commissioning at the Natalka mill and the completion of maintenance works at Blagodatnoye and Verninskoye.
Financial highlights — full year 2017
- Gold sales increased by 13% year-on-year to 2,158 thousand ounces reflecting higher gold production. Total gold sales include 170 thousand ounces of gold contained in concentrate from Olimpiada.
- Revenue totalled $2,721 million, compared to $2,458 million in 2016, driven by increased sales volumes (including flotation concentrate).
- Group TCC decreased to $364 per ounce from $389 per ounce in the previous year. The 13% rouble appreciation was offset by strong operational results and efficiency improvement initiatives. AISC increased to $621 per ounce, up 9% compared to the previous year reflecting mainly higher stripping expenses.
- Adjusted EBITDA increased by 11% year-on-year to $1,702 million, driven by higher gold sales volumes and lower TCC.
- Adjusted EBITDA margin increased to 63% in 2017, compared to 62% in 2016.
- Profit for the year decreased to $1,241 million partially reflecting the impact of a foreign exchange gain in the previous year, as well as finance costs.
- Adjusted net profit for 2017 amounted to $1,015 million, a 7% increase from the prior year.
- Net cash inflow from operations amounted to $1,292 million driven by strong EBITDA.
- Capex was $804 million, primarily due to the ramp-up of construction activity at Natalka. The asset has successfully completed the hot commissioning stage and Polyus currently anticipates production to be fully ramped up in the second half of 2018.
- Cash and cash equivalents as at 31 December 2017 amounted to $1,204 million, compared to $1,740 million as at 31 December 2016, following the early prepayment of credit facilities and dividend payments for the second half of 2016 and the first half of 2017. Following the Secondary Public Offering (“SPO”) conducted on the London Stock Exchange and the Moscow Exchange, the Company used most of the primary proceeds (in a total amount of $400 million) to make early prepayments of several bank credit facilities.
- Net debt decreased to $3,077 million at the end of 2017 compared to $3,241 million as at the end of 2016.
- Net debt/adjusted EBITDA ratio decreased to 1.8x at the end of 2017 compared to 2.1x at the end of 2016 due to higher adjusted EBITDA and a gradual decline in Net debt during the period.
Operational highlights — full year 2017
- Total gold output increased by 10% year-on-year to 2,160 thousand ounces.
- Volumes of ore mined rose by 27% year-on-year to 37,810 thousand tons.
- Volumes of ore processed increased by 8% year-on-year to 28,663 thousand tons, with higher volumes of ore treated at the Company’s core assets as a result of the ongoing execution of expansion projects.
The strength of our assets and the focus on efficiency have enabled Polyus to deliver production numbers above our official guidance of 2,075 — 2,125 thousand ounces for the fourth year in a row, at 2,160 thousand ounces, or 3% higher. Our financial results in 2017 also reflect this: revenue and EBITDA have all shown double-digit growth, with our EBITDA margin remaining among the highest in global natural resources industry at 63%. This has been supported by our ability to decrease total cash costs by 6% compared to the previous year to $364 per ounce, despite the Russian rouble gaining 13% against the dollar during the year.
The investment community has well received our SPO on the Moscow Exchange and the London Stock Exchange in June 2017, with $858 million raised. Following that, our free float increased to 16.34%, which resulted in Polyus shares being included into the MSCI Russia index on the recent revision.
In early 2017, we won the tender for the development of Sukhoi Log, one of the largest undeveloped gold deposits in the world. We are now proceeding with a scoping study and believe that obtaining the Sukhoi Log license is a fundamental achievement that gives us a great position to grow in the coming years.
We expect a 2018 production of 2,375 — 2,425 thousand ounces, and in the second half of the year we anticipate Natalka to be fully ramped up. We will also continue with debottlenecking initiatives at our existing operations that have already strongly contributed to our operational results during the last several years.
Comparative financial results for the years ended 31 December 2016 and 2017
|
$ million (if not mentioned otherwise) |
2017 | 2016 | Y-o-Y |
4Q 2017 |
3Q 2017 |
Q-o-Q | |
|---|---|---|---|---|---|---|---|
| Operating highlights | |||||||
| Gold production (koz) | 2,160 | 1,968 | 10% | 580 | 642 | 10% | |
| Gold sold (koz) | 2,158 | 1,915 | 13% | 597 | 578 | 3% | |
| Realised prices | Average realised refined gold price (excluding effect of SPPP) ($/oz) | 1,260 | 1,250 | (1%) | 1,275 | 1,279 | (0%) |
| Average realised refined gold price (including effect of SPPP) ($/oz) | 1,271 | 1,287 | (1%) | 1,275 | 1,279 | (0%) | |
| Financial performance | |||||||
| Total revenue | 2,721 | 2,458 | 11% | 743 | 744 | (0%) | |
| Operating profit | 1,455 | 1,361 | 7% | 391 | 410 | (5%) | |
| Operating profit margin | 55% | 57% | (2) ppts | 53% | 55% | (2) ppts | |
| Profit for the period | 1,241 | 1,445 | (14%) | 267 | 371 | (28%) | |
| Earnings per share — basic (US Dollar) | 9.64 | 10.09 | (4%) | 2.05 | 2.74 | 25% | |
| Earnings per share — diluted (US Dollar) | 9.61 | 10.09 | (5%) | 2.05 | 2.73 | (25%) | |
| Adjusted net profit | 1,015 | 952 | (7%) | 242 | 298 | 19% | |
| Adjusted net profit margin | 37% | 39% | (2) ppts | 33% | 40% | (7) ppts | |
| Adjusted EBITDA | 1,702 | 1,536 | 11% | 465 | 475 | 2% | |
| Adjusted EBITDA margin | 63% | 62% | 1 ppts | 63% | 64% | (1) ppts | |
| Net cash inflow from operations | 1,292 | 1,178 | 10% | 344 | 398 | (14%) | |
| Capital expenditure | 804 | 466 | 73% | 279 | 224 | 25% | |
| Cash costs | |||||||
| Total cash cost (TCC) per ounce sold ($/oz) | 364 | 389 | (6%) | 324 | 380 | (15%) | |
| All-in sustaining cash cost (AISC) per ounce sold ($/oz) | 621 | 572 | 9% | 662 | 599 | 11% | |
| Financial position | |||||||
| Cash and cash equivalents | 1,204 | 1,740 | (31%) | 1,204 | 1,121 | (7%) | |
| Net debt | 3,077 | 3,241 | (5%) | 3,077 | 3,151 | (2%) | |
| Net debt/adjusted EBITDA (x) | 1.8 | 2.1 | (14%) | 1.8 | 1.9 | (5%) |
Total Cash Costs
In 2017, group TCC decreased 6% to $364 per ounce, despite the local currency strengthening by 13% compared to the prior year. The rouble appreciation was fully offset by strong operational results during the period assisted by the contribution from a higher grade in ore processed at Olimpiada, the cessation of higher-cost Veduga ore processing, a lower power tariff in the Far Eastern Federal District, as well as other initiatives.
TCC performance by mine, $/oz
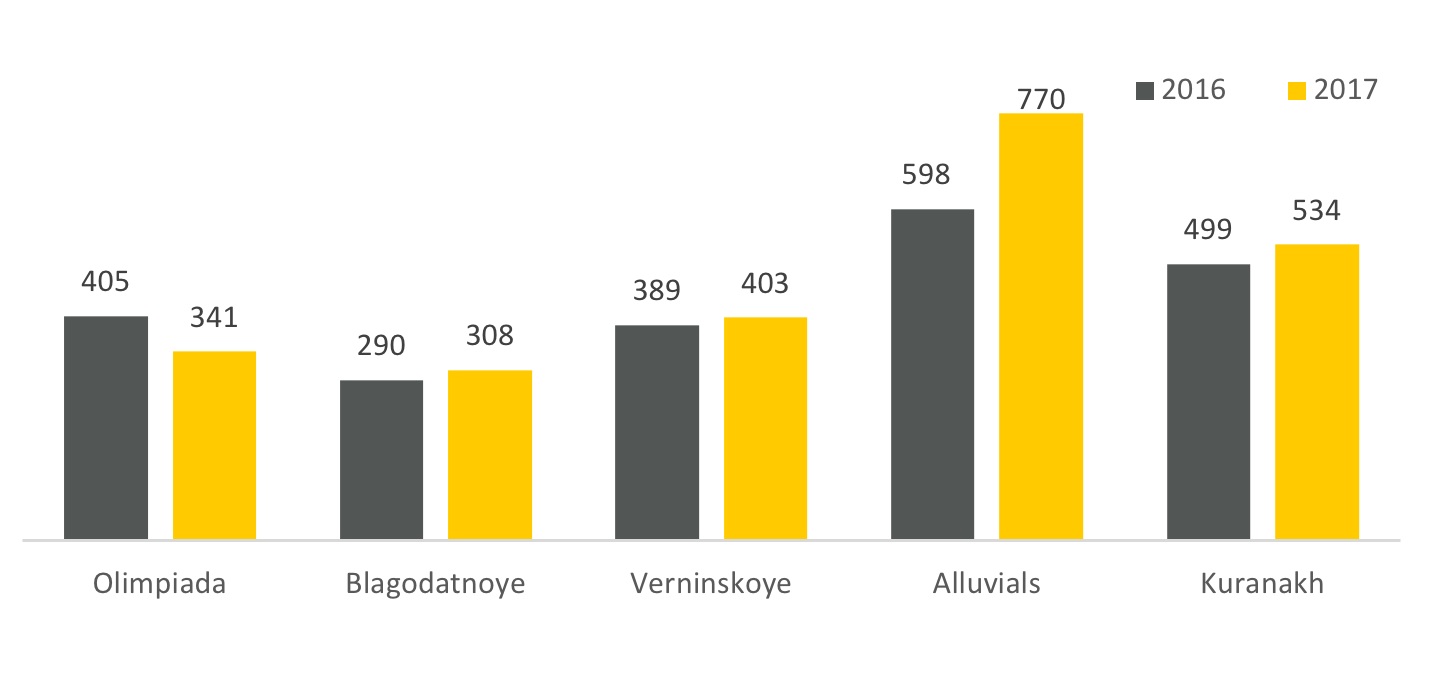
In 2017, TCC at Olimpiada declined to $341 per ounce, posting a 16% decrease from the previous year. This reduction was mainly attributable to higher average grades in ore processed (3,8 grams per tonne in 2017 compared to 3,3 grams per tonne in 2016), the cessation of higher cost Veduga ore processing, the improved performance of Mill-1 (following its reconfiguration) and Mill-3, as well as lower repair levels compared to 2016. This was partially offset by an increased consumption of reagents (sulfuric acid) reflecting variations in the ore mineral composition.
At Blagodatnoye, 2017 TCC amounted to $308 per ounce, up 6% compared to the previous year, primarily due to the local currency appreciation and negative impact of lower grades in ore processed (following the intensification of mining activity at lower-grade sites). Notably, in rouble terms TCC decreased following the ongoing debottlenecking of throughput capacities and decline in cost per tonne of ore mined envisaged by mining plan for the respective years.
TCC at Verninskoye amounted to $403 per ounce, up 4% in comparison with the prior year. However, in rouble terms, TCC remained almost flat as the increase in labour costs, and the higher cost of consumables and fuel were offset by operational improvements, including a gradual increase in hourly throughput and recoveries following improvements at the flotation, carbon-in leach (CIL) and cyanidation circuits.
At Kuranakh, TCC increased to $534 per ounce, posting a 7% increase compared to the previous year. Importantly, in rouble terms TCC decreased as a result of initiatives to expand the Mill’s throughput capacity, with the improved productivity of the grinding equipment. Moreover, there was a sharp decline in power expenses due to enactment of the federal decree on the power tariff in the Far Eastern Federal District.
TCC at Alluvials increased to $770 per ounce, compared to $598 per ounce in 2016, primarily due to local currency appreciation and a decline in alluvial gold grade (0,54 grams per cubic metre in 2017 compared to 0,61 grams per cubic metre in 2016).
All-In Sustaining Costs
In 2017, the Group’s AISC per ounce increased to $621 per ounce, up 8% compared to the previous year. This growth was primarily driven by higher stripping expenses.
AISC performance by mine, $/oz
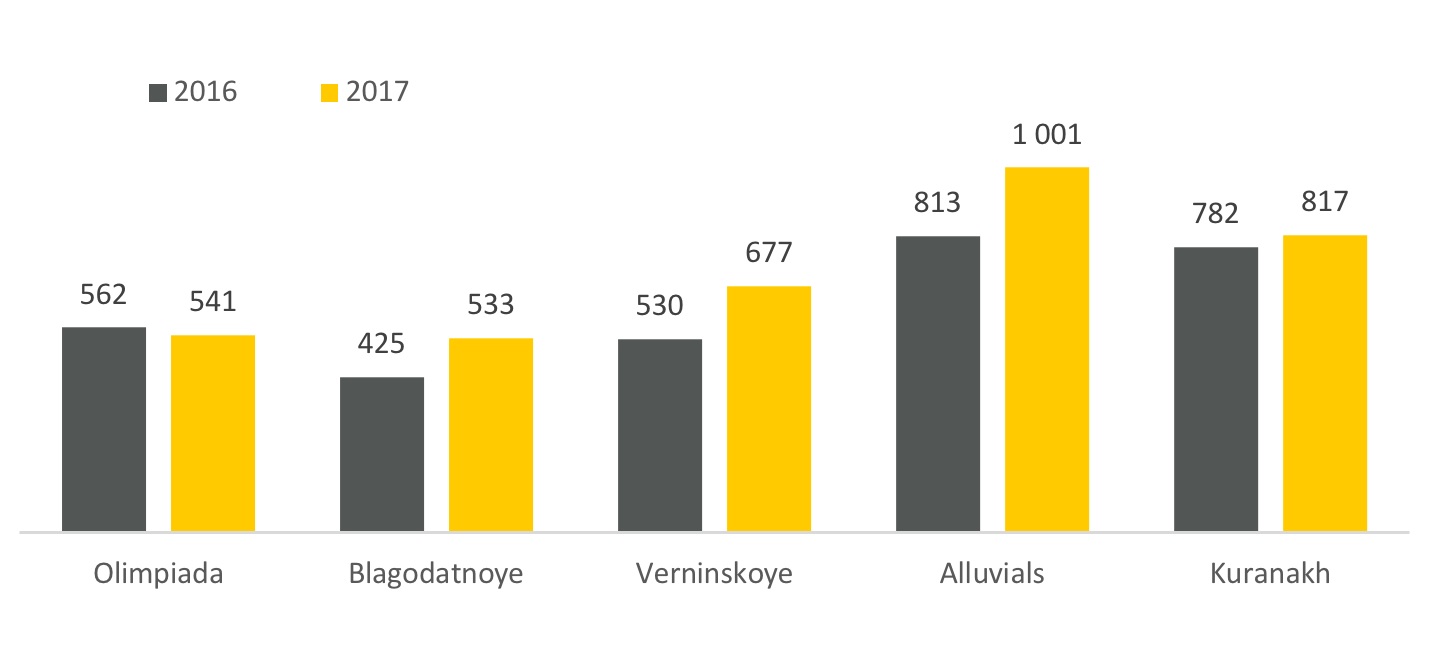
AISC at Olimpiada remained almost flat compared to prior year as lower TCC were offset by an increase in sustaining capital expenditure and stripping expenses. At Blagodatnoye, AISC increased to $533 per ounce as a result of a planned increase in stripping activity (rock moved volumes rose 55% during the year). Verninskoye posted a 28% increase in AISC from the previous year due to higher stripping expenses and sustained capital expenditure. At Kuranakh, AISC increased to $817 per ounce driven by higher TCC for the period.
Capex
Capital expenditures increased during 2017 to $804 million, from $466 million in the previous year. This increase reflects higher maintenance capital expenditures, the ongoing construction works at Natalka, and brownfield development projects. The capex figure of $804 million is within the guidance of $800—850 million.
Capital expenditures at Natalka, the Group’s main development project, increased 77%, to $378 million. Mining activity at Natalka was relaunched in January 2017 (the deposit was previously mined from 2013 through 2014). As of the end of December 2017, almost the entire processing flow sheet was fully operational, with technical works fully completed at the desorption circuits in January 2018. In addition, the Company received a positive resolution from the Federal Industrial Supervision Service of Russia («Rostechnadzor»), which conducted an industrial audit at Natalka in December 2017. Currently, Natalka operates in a ramp-up mode. Completion of the full ramp up is anticipated in the second half of 2018.
Capital expenditures at Olimpiada increased to $177 million due to preparations to connect the mine to the new Razdolinskaya-Taiga grid, procurement of a new mining fleet, and the construction of Bio Oxidation circuit («BIO-4») at the Mills-1, 2, and 3 complex. The first four reactors of the BIO-4 project were installed in 2017 whereas the remaining four reactors are scheduled for the first half of 2018.
At Blagodatnoye, capital expenditures increased to $49 million in 2017, primarily due to optimisation works at the Blagodatnoye Mill following the completion of the processing capacity expansion project.
At Verninskoye, capital expenditures increased to $39 million in 2017 mainly due to further implementation of the Verninskoye Mill expansion project.
Capital expenditures at Kuranakh increased to $65 million due to further progress with the heap leach project and the launch of the second stage of the Kuranakh Mill processing capacity expansion to 5,0 mtpa. The heap-leaching operations launched in September 2017 should intensify in the first half of 2018 with the launch of leaching season.
At Alluvials, capital expenditures increased to $26 million in 2017 compared to the prior year and consisted of exploration activity as well as the ongoing replacement of worn-out equipment.
Capex breakdown, $ million
| 2017 | 2016 | Y-o-Y |
4Q 2017 |
3Q 2016 |
Q-o-Q | |
|---|---|---|---|---|---|---|
| Natalka | 378 | 213 | 77% | 94 | 107 | 12% |
| Olimpiada | 177 | 80 | 121% | 84 | 41 | 105% |
| Blagodatnoye | 49 | 20 | 145% | 19 | 17 | 12% |
| Verninskoye | 39 | 24 | 63% | 16 | 11 | 45% |
| Alluvials | 26 | 16 | 63% | 9 | 5 | 80% |
| Kuranakh | 65 | 33 | 97% | 26 | 17 | 53% |
| Other | 70 | 80 | 13% | 31 | 7 | N.A. |
| Capex | 804 | 466 | 73% | 279 | 205 | 36% |
In 2018, Polyus plans to invest approximately $850 million across the business, including $250 million of maintenance capex. The figure also includes approximately $150 million of capitalised operating expenses related to the Natalka operations.
Conference Call
Polyus will host an analyst conference call on 19 February at 1 p.m. London time / 4 p.m. Moscow time to present and discuss the financial results for the year 2017.
To join the conference call, please dial:
UK:
+44 (0) 330 336 9411 (Local access)
0 800 279 7204 (Toll free)
USA:
+1 323-794-2551 (Local access)
800-239-9838 (Toll free)
Russia:
+7 495 213 1767 (Local access)
8 800 500 9302 (Toll free)
Conference ID: 1389089
A replay of the conference call will be available for 30 days:
UK:
+44 (0) 207 660 0134 (Local access)
0 808 101 1153 (Toll free)
USA:
+1 719-457-0820 (Local access)
0 808-101-1153 (Toll free)
Russia:
810 800 2702 1012 (Toll free)
Passcode: 1389089
Polyus
The Polyus group is the largest gold producer in Russia and one of the top 10 gold miners globally with the lowest cost position. Based on its 2016 Ore Reserves and Mineral Resources, the Polyus group ranks second by attributable gold reserves and third by attributable gold resources among the world’s largest gold mining companies.
The Polyus group’s principal operations are located in Krasnoyarsk, Irkutsk and Magadan regions and the Sakha Republic (Yakutia).
Enquiries:
Investor contact
Victor Drozdov, Director Investor Relations
+7 (495) 641 33 77
drozdovvi@polyus.com
Media contact
Victoria Vasilyeva, Director Public Relations
+7 (495) 641 33 77
vasilevavs@polyus.com
Forward looking statements
This announcement may contain «forward-looking statements» concerning Polyus and/or Polyus group. Generally, the words “will”, “may”, “should”, “could”, “would”, “can”, “continue”, “opportunity”, “believes”, “expects”, “intends”, “anticipates”, “estimates” or similar expressions identify forward-looking statements. The forward-looking statements involve risks and uncertainties that could cause actual results to differ materially from those expressed in the forward-looking statements. Forward-looking statements include statements relating to future capital expenditures and business and management strategies and the expansion and growth of Polyus’ and/or Polyus group’s operations. Many of these risks and uncertainties relate to factors that are beyond Polyus’ and/or Polyus group’s ability to control or estimate precisely and therefore undue reliance should not be placed on such statements which speak only as at the date of this announcement. Polyus and/or any Polyus group company assumes no obligation in respect of, and does not intend to update, these forward-looking statements, except as required pursuant to applicable law.
1 Total cash costs per ounce sold (TCC) is defined by the Group as the cost of gold sales, less property, plant and equipment depreciation and amortisation, provision for annual vacation payment, employee benefits obligation cost and change in allowance for obsolescence of inventory and adjusted by inventories. TCC per ounce sold is the cost of producing an ounce of gold, which includes mining, processing and refining costs. The Group calculates TCC per ounce sold as TCC divided by total ounces of gold sold for the period. The Group calculates TCC and TCC per ounce sold for certain mines on the same basis, using corresponding mine-level financial.
2 All-in-sustaining costs per ounce sold (AISC) is defined by the Group as TCC plus selling, general and administrative expenses, research expenses, other sustaining expenses, stripping activity asset additions, sustaining capital expenditures, unwinding of discounts on decommissioning liabilities, provision for annual vacation payment, employee benefit obligations cost, and change in allowance for obsolescence of inventory less amortisation and depreciation included in selling, general and administrative expenses. AISC is an extension of TCC and incorporates costs related to sustaining production and additional costs which reflect the varying costs of producing gold over the life-cycle of a mine. The Group believes AISC is helpful in understanding the economics of gold mining. AISC per ounce sold is the cost of producing and selling an ounce of gold, including mining, processing, transportation and refining costs, general costs from both mine and alluvial operations, and the additional expenditures noted in the definition of AISC. The Group calculates AISC per ounce sold as AISC divided by total ounces of gold sold for the period.
3 Adjusted EBITDA is defined by the Group as profit for the period before income tax, depreciation and amortisation, (gain) / loss on derivative financial instruments and investments (including the effect of the disposal of a subsidiary and subsequent accounting at equity method), finance costs, net, interest income, foreign exchange gain, net, impairment loss / (reversal of impairment), (gain) / loss on property, plant and equipment disposal, expenses associated with an equity-settled share-based payment plan and special charitable contributions as required to ensure calculation of the Adjusted EBITDA is comparable with the prior period. The Group has made these adjustments in calculating Adjusted EBITDA to provide a clearer view of the performance of its underlying business operations and to generate a metric that it believes will give greater comparability over time with peers in its industry. The Group believes that Adjusted EBITDA is a meaningful indicator of its profitability and performance. This measure should not be considered as an alternative to profit for the period and operating cash flows based on IFRS, and should not necessarily be construed as a comprehensive indicator of the Group’s measure of profitability or liquidity. The Group calculates Adjusted EBITDA margin as Adjusted EBITDA divided by total revenue.
4 Adjusted net profit is defined by the Group as net profit / (loss) for the period adjusted for impairment loss / (reversal of impairment), unrealised (gain) / loss on derivative financial instruments and investments, net, foreign exchange (gain) / loss, net, and associated deferred income tax related to such items.
5 Capital expenditure figures are presented on an accrual basis (here presented net of the Sukhoi Log deposit license acquisition cost) and net of Omchak power grid construction cost.
6 Net debt is defined as non-current borrowings plus current borrowings less cash and cash equivalents and bank deposits. Net debt excludes derivative financial instrument assets/liabilities, site restoration and environmental obligations, deferred tax, deferred revenue, deferred consideration for the Sukhoi Log licence and other non-current liabilities. Net debt should not be considered as an alternative to current and non-current borrowings, and should not necessarily be construed as a comprehensive indicator of the Group’s overall liquidity.